In the top right-hand corner of any report find the Download button that looks like this:
Clicking on the download button will allow you to save an Excel file of the exact information used to create the chart you are currently viewing.
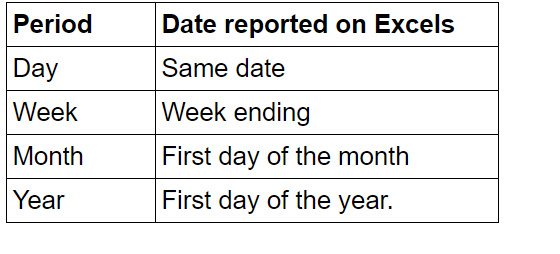
The Excel file will be structured with a column for each of the parameters visualized and the rows for the period number (the day, week, month, or year) as well as the date of the period being observed.
For example, a weekly report of prices by origin will offer an Excel file with columns that start with the date, the period of the report, and each of the origins available in the chart. The rows will contain the values for each of these columns, showing the period and the date next to their associated prices or volumes that are visualized in the chart.